FP&A & KPI Dashboards
LiveBudget, actuals and the story behind the variance.
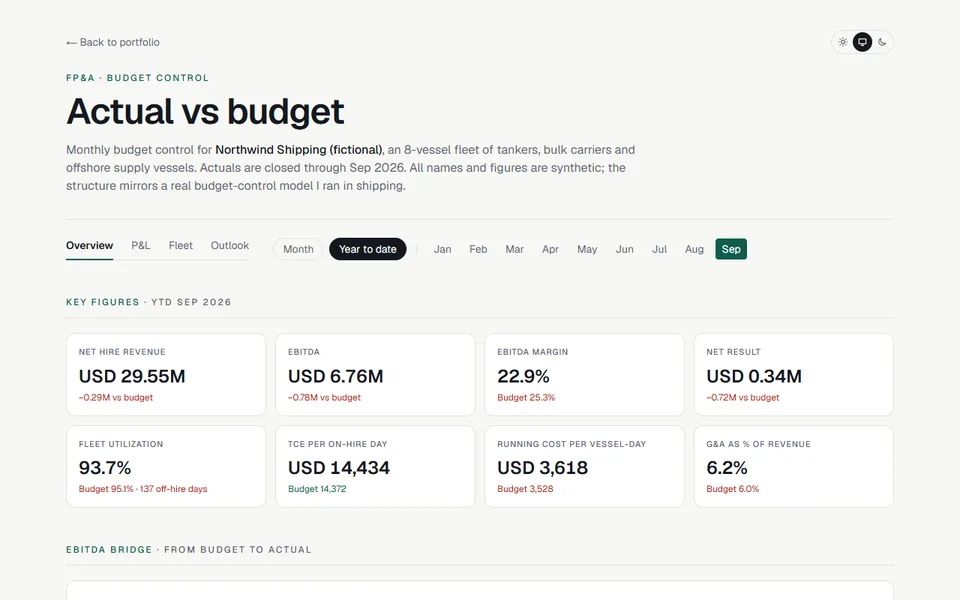
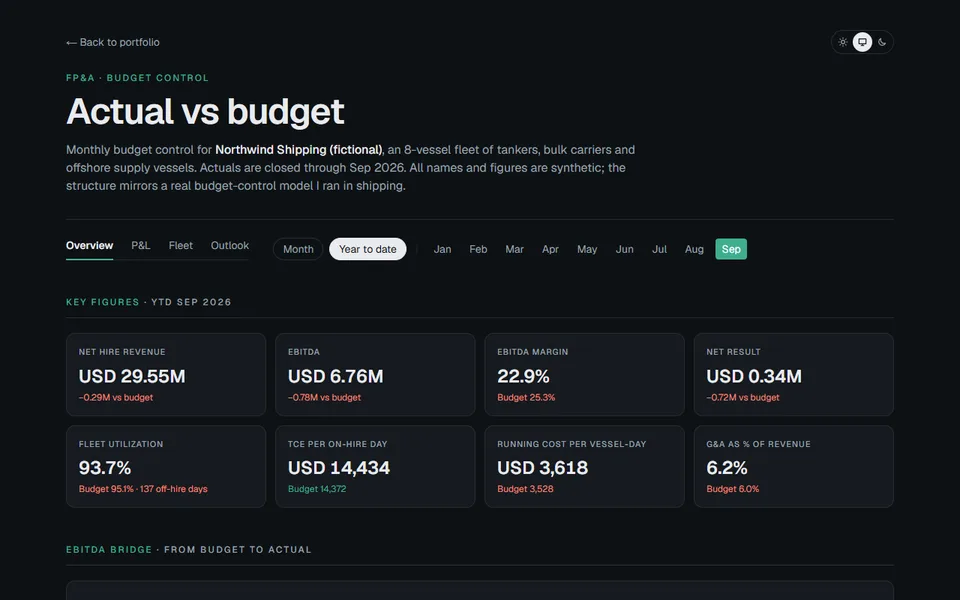
Monthly budget control for a fictional 8-vessel shipping company: P&L budget vs actual, fleet KPIs, an EBITDA bridge, a full-year outlook, three linked statements with a 13-week cash forecast, scenario levers and a Monte Carlo of liquidity.
- ▸P&L cascade budget vs actual, by month or year to date
- ▸EBITDA bridge: rates, off-hire, crew, running cost, G&A
- ▸Fleet KPIs: utilization, TCE/day, running cost per vessel-day
- ▸Outlook (actual + forecast) and automated variance commentary
- ▸P&L, balance sheet and cash flow that reconcile, with 6 integrity checks
- ▸13-week cash vs minimum liquidity: scenario levers, 1,000 simulations, CFO briefing
BudgetingForecastingKPIsAutomation